Core troubleshooting
Start with the affected function and time. Compare the same period in Rancher, Grafana and the Portal.
Choose the first check
Symptom | First view | Next action |
|---|---|---|
The Portal and Rancher do not load | A session on the Core server. | Follow Unresponsive Core. |
Grafana shows Page not found | Rancher. | Follow Reopen Grafana below. |
High CPU or memory pressure | Node Exporter / Nodes. | Open Kubernetes / Compute Resources / Namespace (Workloads) to compare services. |
Missing GPU or other readings | The affected Grafana panel. | Follow Missing measurements below. |
Growing processing delay | Inference services. | Compare requests, errors and duration with GPU use. |
Delayed events or media | Kafka Exporter and event-worker logs. | Check whether consumer lag grows and delivery errors repeat. |
Delayed search results | innovi-core-indexer and ElasticSearch dashboards. | Inspect indexer errors and physical free disk space. |
Offline camera or Edge | Portal → Administrator → Physical view. | Separate one affected camera from an affected Edge as described below. |
Backup or cleanup failure | Rancher → Workloads → CronJobs. | Check the latest Job and logs in Core maintenance. |
Consumer lag measures how far message processing trails incoming messages. A growing backlog needs investigation; it does not directly measure delay in seconds.
Unresponsive Core
Use these checks when the Portal and Rancher do not load. They need an SSH session on the Core server with sudo rights, and they only read state.
- Check free disk space with df -h.
- Read the running kernel version with uname -r.
- List the pods with sudo kubectl get pods -A.
- Look for pods whose STATUS is not Running or Completed, or whose READY count is incomplete, such as 0/1.
A full root or /mnt/irisplus-data filesystem can stop services. Compare the kernel version with the one the installation manual specifies. An operating system update can install a different kernel, which can stop the GPU driver from loading.
Send the output to Irisity with the support information.
Reopen Grafana
The Target link opens Grafana in a new browser tab, which can show Page not found. Grafana's own menu still works from this screen.
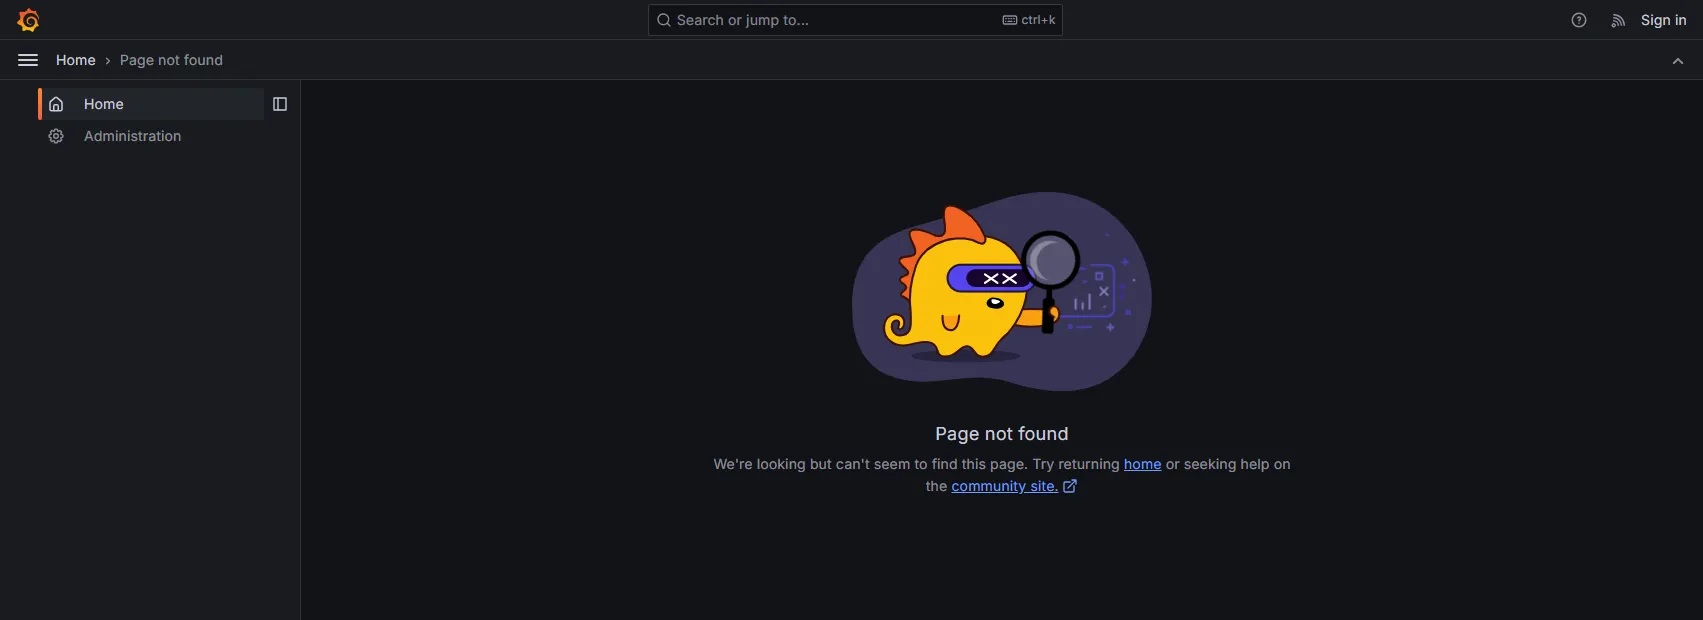
If Grafana's menu lists Dashboards:
- Select Dashboards.
- Type the dashboard name in the search box.
- Open the dashboard.
If the menu lists only Home and Administration, sign in first:
- Select Administration.
- Select Home to open the Grafana sign-in form.
- Sign in with your Grafana account.
- Return to the Rancher tab with the Services list.
- Select the Grafana Target link again.
- Select Dashboards in Grafana's menu.
After step 3, the browser can show the Rancher home page. Steps 4 and 5 bring you back to Grafana.
Move between dashboards with Grafana's menu. A reloaded or bookmarked Grafana page opens a Rancher error page. Then start again from the Target link.
If neither Rancher nor the Portal loads, follow Unresponsive Core. If the Target link or Grafana's menu is unavailable, reach out to Irisity.
Missing measurements
Use these checks when a dashboard shows No data or expected metrics are missing.
- Check the panel's time range.
- Check its server, service and model filters.
- Check the selected data source.
- Open Rancher → Monitoring.
- Select Prometheus Targets, if available.
- Read the collection error for any affected target marked Down.
If access is denied, ask your installation administrator for permission. If Monitoring or Prometheus Targets is unavailable, or its link fails, reach out to Irisity.
If collection succeeds but a supplied panel remains empty, reach out to Irisity with its dashboard name, filters, time range and error.
Locate the service and read logs
The following names apply to the R2.1 package. Select the namespace before finding a workload.
Function | Namespace | Workload or pod |
|---|---|---|
Edge analytics connections | app | innovi-core-agent-proxy |
Edge management connections | app | innovi-core-device-proxy |
Model processing | app | innovi-inference-service-2, innovi-inference-service-2-pai-1, innovi-triton-service |
Events and media | app | innovi-core-event-worker-service |
Metadata and event indexing | app | innovi-core-indexer |
Messaging | data | Pods kafka-kafka-0, kafka-kafka-1, kafka-kafka-2 |
Search storage | data | StatefulSets elasticsearch-es-master, elasticsearch-es-data |
A StatefulSet manages service instances that keep their identities and storage. A Kafka consumer group contains service instances that share message processing.
In Kafka, event_service_events is the event-worker consumer group. event_indexer and metadata_indexer belong to the indexer.
To inspect an affected service:
- Open Rancher → Workloads.
- Select its namespace.
- Open its workload.
- Select an affected pod.
- Inspect the pod's conditions and events.
- Open the affected container's Logs.
- Select previous-container logs if the container restarted.
Check timestamps and repeated errors before changing or restarting anything. A cumulative restart count alone does not show a current failure.
Offline camera or Edge
In Portal → Administrator → Physical view, select the affected camera or Edge. Review its connection information and Health alerts.
- One camera: check its network connection, stream source and camera health alerts.
- Several cameras on one Edge: check the Edge connection, network and local resources. Follow Edge monitoring.
- Several Edges: check shared network paths and the Core connection services listed above.
Pause load increases while persistent faults remain. Use the support information if you need help resolving the fault.